Summary
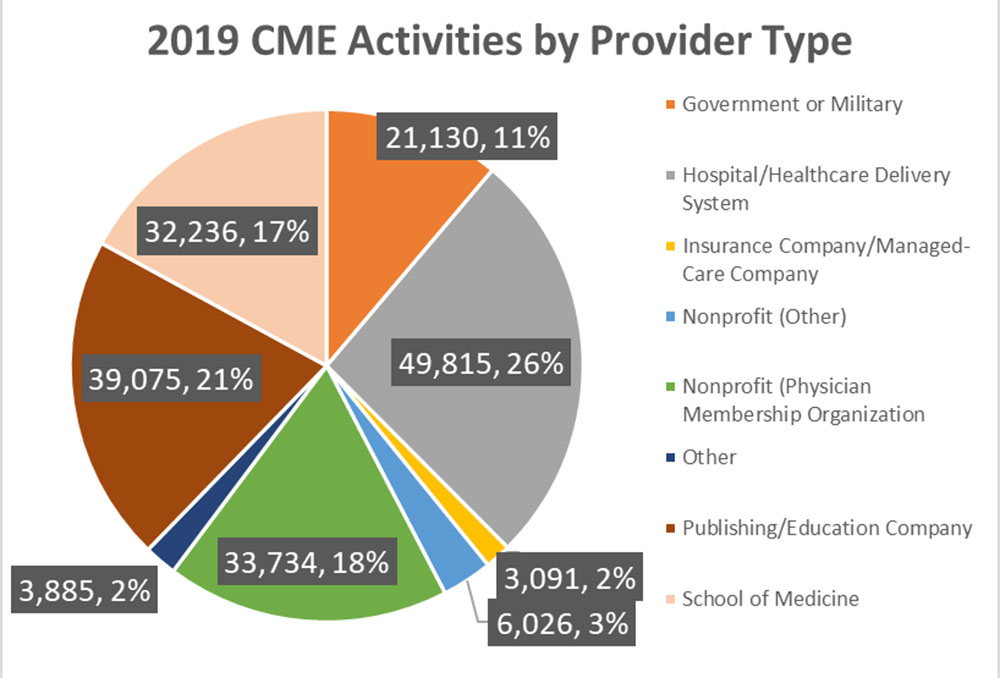
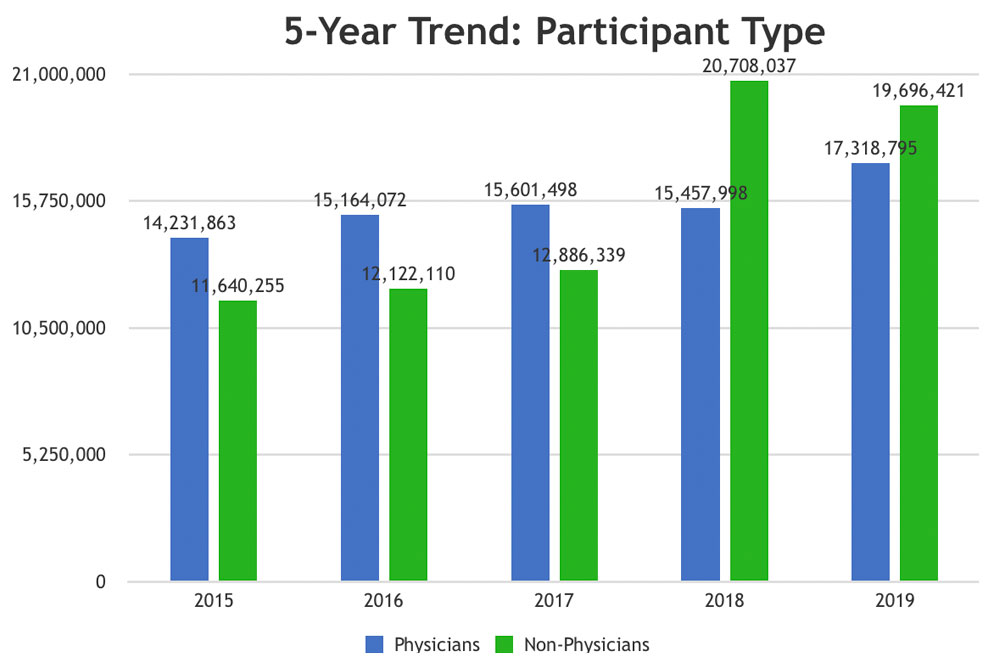
The ACCME’s 2019 Annual Report data was released on July 31, 2020. The report highlights continued growth in several key areas, analyzing data from over 1,700 accredited CME providers that offered nearly 190,000 accredited CME activities. Analysis shows a noteworthy shift in data regarding participants attending CME activities. For the second straight year, non-physician participants (53%) attending CME activities surpassed physician participants (47%), though non-physician participants decreased in 2019 as compared to 2018. Three-year trend data below illustrates that the number of physician participants has increased by 11.01% while the number of non-physician participants at CME activities has increased by 52.85% since 2017. The number of physician learners increased in 2019 by nearly two million after remaining steady the previous three years, while the number of non-physician learners decreased for the first time this year by approximately one million. The number of educational activities and participants continue to increase and have each year since 2010. Effectively, the CME enterprise continues to evolve and make available high-quality, CME activities that promote interprofessional learning and improvements across clinician competence, performance, and patient outcomes.
2019 Stats
- Accredited educational activities grew by 5.49%; accredited initiatives have increased each year since 2010, with the increase from 2018 to 2019 being the largest, to date.
- Total physician participation at CME activities increased while non-physician participation decreased. Non-physician participation decreased by approximately 5% from 2018. Physician participation showed large growth with a 12% increase as compared to 2018.
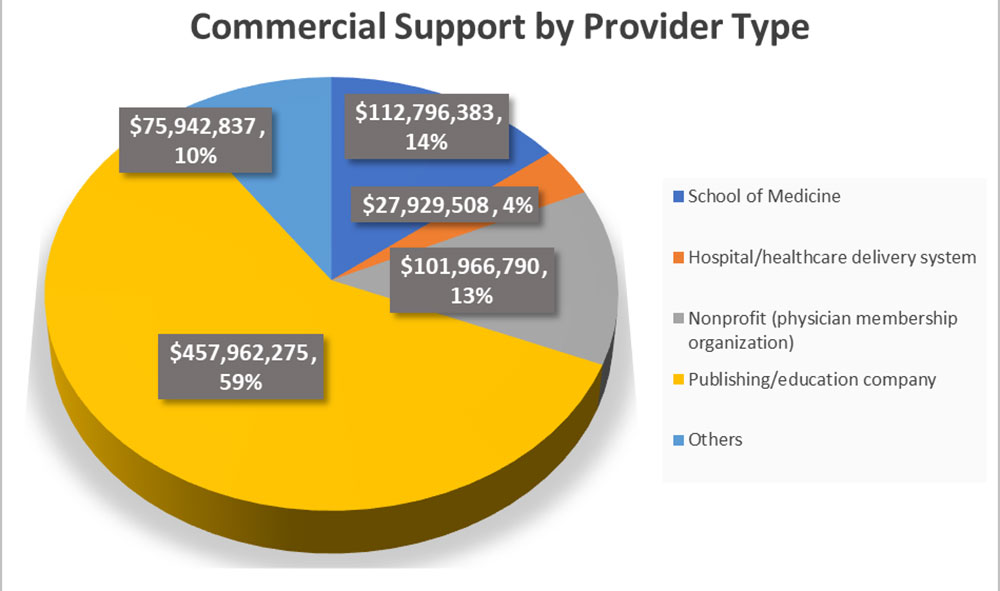
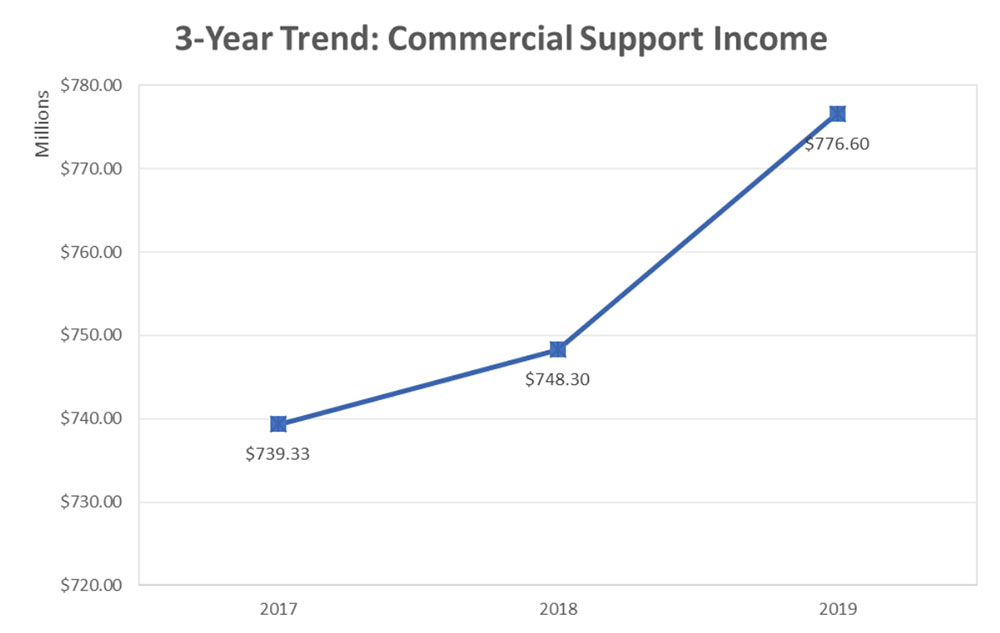
- Total commercial support contributions rose by 3.78%, an estimated $28 million.
- Income from advertising/exhibits increased from $499 million in 2018 to $542 million in 2019, an 8.62% increase.
- Total annual income for CME increased by $225 million, a 7.95% increase.
- Of total attendance at CME activities, 47% of attendees were physicians and 53% were non-physicians.
Provider Type Comparison Data
5-Year Trend Data
3-Year Trend Data
For a full copy of the ACCME 2019 Annual Report, visit: https://www.accme.org/news-releases/accme-data-report-shows-steady-growth-accredited-continuing-medical-education-2019


